Next: Technology: Communication, Computers, and
Up: Communication: Research and Teaching
Previous: An illustration: Midterm Evaluations
Contents
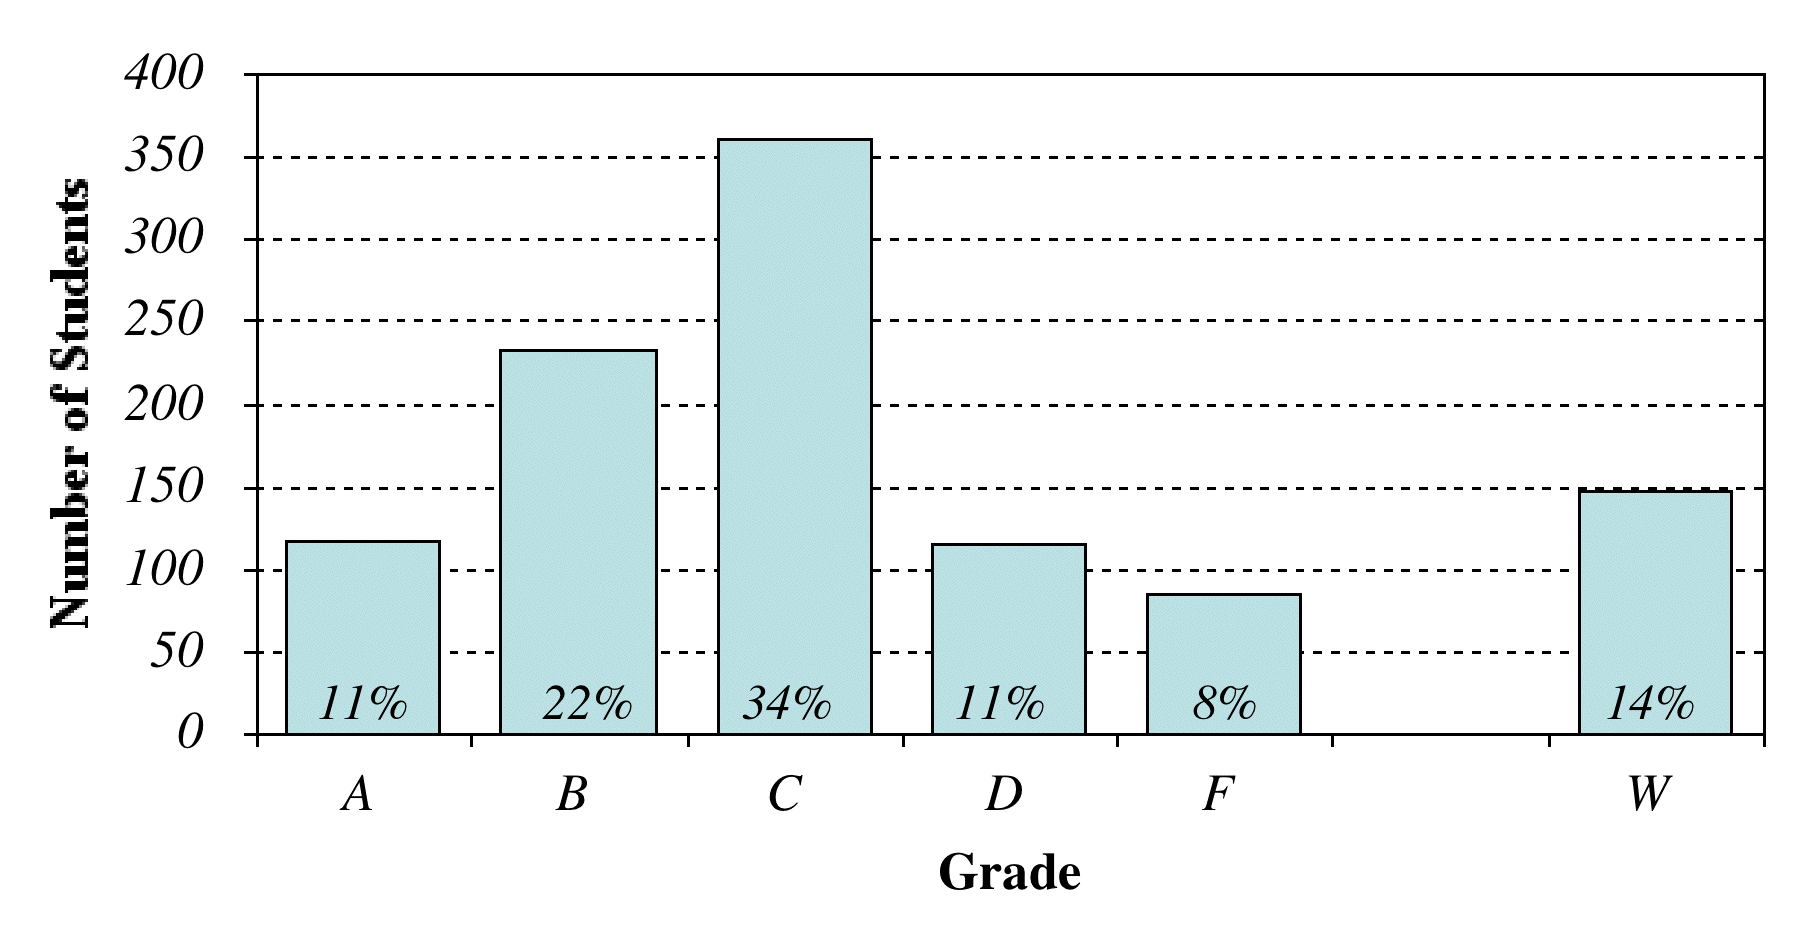
As an indicator of the pattern in my mentoring of students, I have
included Figure 3 below. Of the 1061 students who have remained
in a class with me for at least three weeks4, I have advised 148 (14%) of them out
of the class. Thirty-five of those 148 have returned to my course later, 29 of them
passed. Through no conscious effort on my part - other than the advising
of students to withdraw if they felt they could not devote the needed effort to the course - the
cummulative grade distribution for students who have remained in my classes is
rather close to the (pre-1960's) traditional 10% A, 20% B, 40% C, 20% D,
10% F.5
Figure 3:
Distribution of grades for students remaining in my classes.The far right bar, W, represents students who withdrew after the third
week of class.
|
|
I do not especially hold the bell curve
in esteem and have frequently taught entry level courses where a
distinctly bi-modal distribution of student effort and performance (split
between B and D) has emerged. Nonetheless, with almost 1100 students, the
distribution does indeed smooth out and peak in the middle.
Next: Technology: Communication, Computers, and
Up: Communication: Research and Teaching
Previous: An illustration: Midterm Evaluations
Contents
Shandy Hauk
2007-01-18